¶ Statistics
On statistics panel you have access to four different graphs. You can see statistics from all vine countries.
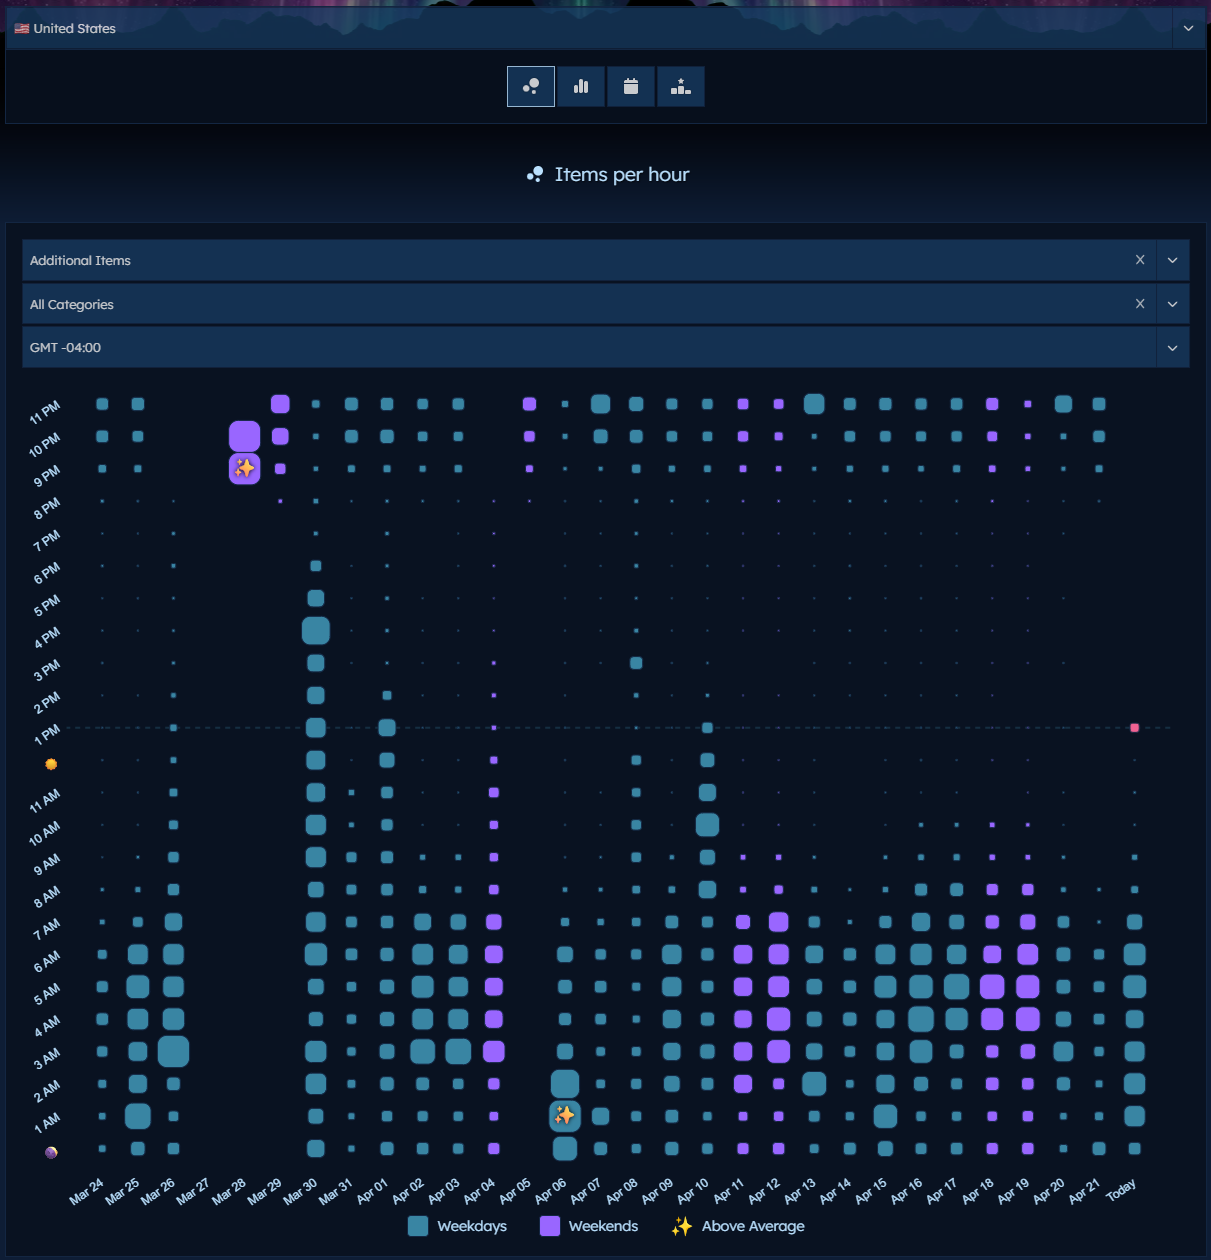
¶ Items per hour
This view allows you to see the "hot times" that products are being added on vine. Can be filtered by queue type, categories and timezones.
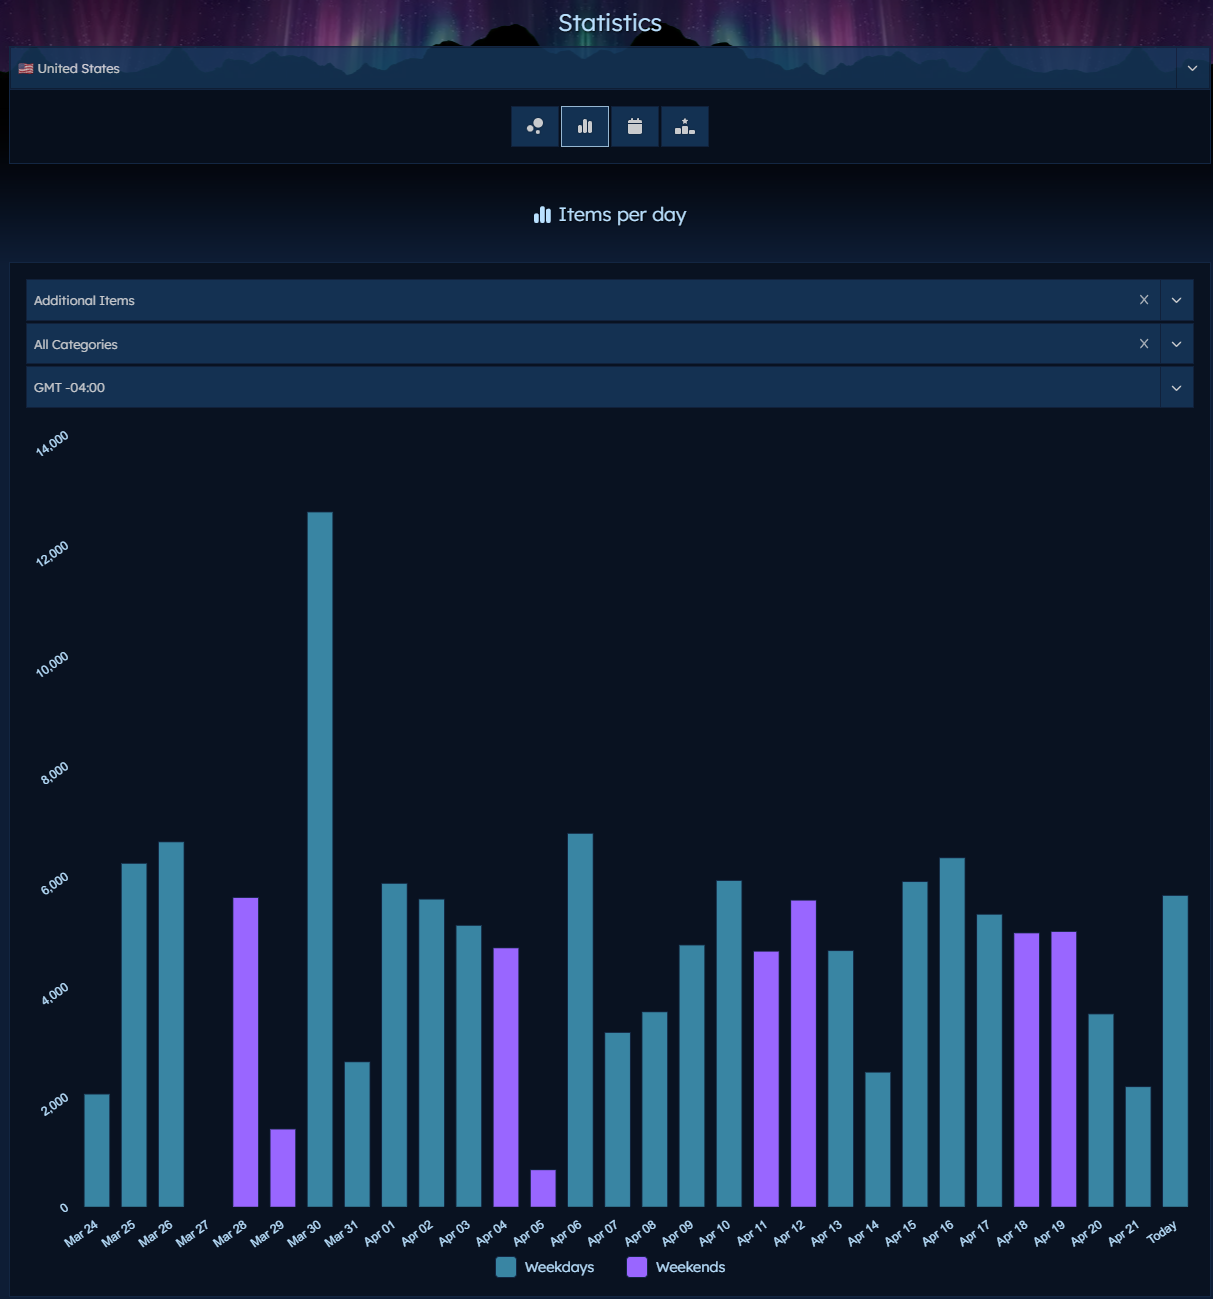
¶ Items per day
This view is a more condensed look. You can see the variation daily related to the volume of products. Can be filtered by queue type, categories and
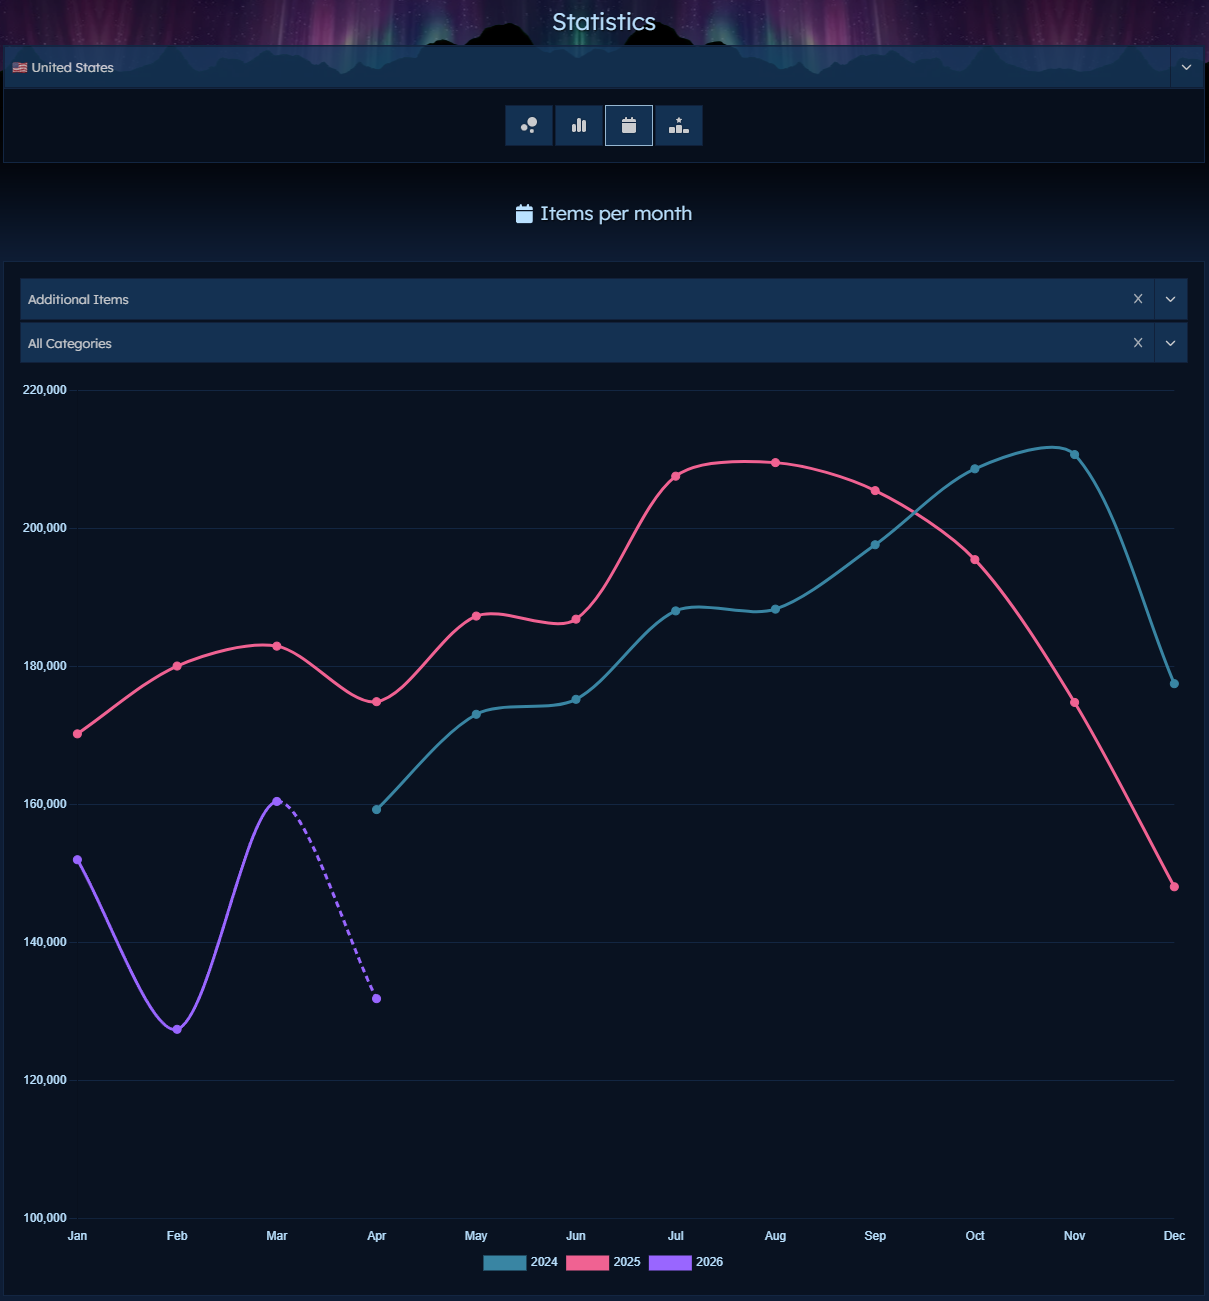
¶ Items per month
This view let you compare the product volume between years. Can be filtered by queue type and categories.
¶ Contributions
This view show what ultraviner users find the most products. Can be viewed based on the past month data or all-time data.